Survey: What Do Frontline Workers Think About Employee Comms? (2023 Update)
Each year, we survey 1,000 frontline workers to find out what they really think about the communication they receive from their employers. We asked them about their satisfaction with comms, what channels they prefer, whether they would be willing to BYOD, how much they trust their company/manager, and more.

Executive Summary
theEMPLOYEEapp was created by communication and human resources professionals to address the challenges that companies face communicating with frontline workers. That’s why in 2021, we conducted our first State of Frontline Worker Communication survey. We conducted our second annual survey of 1,000 frontline employees in 2022 to get a finger on the pulse of what communication is like on the front lines.
In this guide, we’ll review the findings from the survey and suggest next steps. But first, we wanted to highlight some of the important themes that emerged from the study:
- Internal communication is critical to key business indicators. In both 2021 and 2022, we saw a correlation between higher communication satisfaction rates among managers and metrics like employee engagement, trust, and retention. This indicates that good internal communication has a real and profound impact on business success.
- Non-manager communication has to be a focus. The gap between managers and non-managers on a variety of questions indicates that we need to be better at directly reaching our frontline employees and we need to get better at training frontline managers to be good communicators.
- Companies are embracing more mobile channels than before. In 2021, 44% of employees said they received text messages and 16% said they received comms via an employee app. Those numbers both increased in 2022. Now, 57% of companies are using text to communicate and 25% use an employee app. The workforce is more dispersed than ever and more Gen Zers are starting to work, signaling a shift in how companies are choosing to reach their teams.
Survey Demographics
We surveyed 1,000 frontline workers to learn how they feel about employee communications at their company.
Gender
- Female: 57%
- Male: 43%
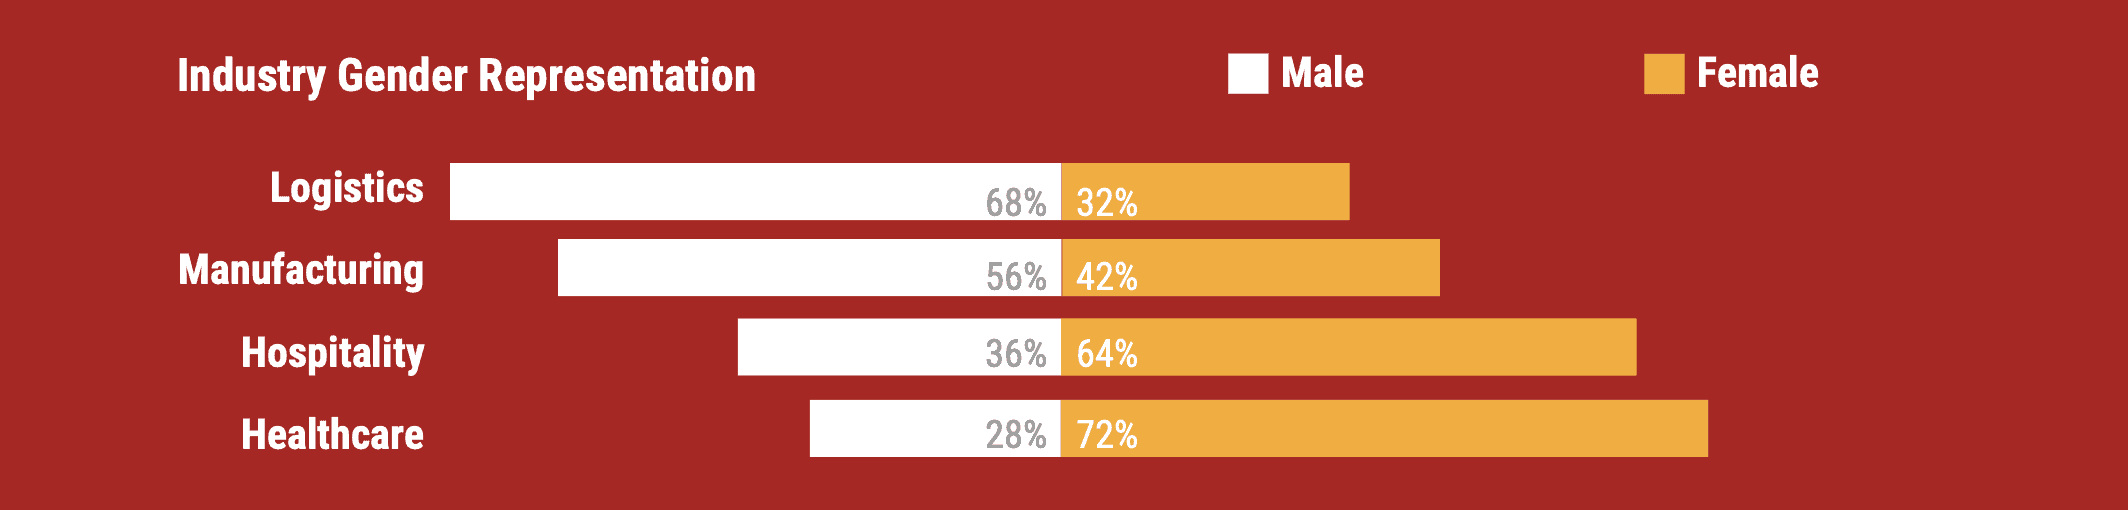
Industry Representation
- Hospitality: 32%
- Healthcare: 31%
- Manufacturing: 24%
- Logistics: 12%
Are You a People Manager?
- Yes: 59%
- No: 41%
Number of Employees At Your Company
- Less than 50: 28%
- 50 – 250: 18%
- 251 – 500: 10%
- 501 – 1000: 9%
- 1001 – 5000: 10%
- 5000 or more: 19%
- Unsure: 6%
Education Level
- University: 42%
- High School: 37%
- Vocational/Technical College: 12%
- Post-Graduate Degree: 8%
- Middle School: 1%
Ethnicity
- White: 50%
- Hispanic: 20%
- Black: 15%
- Asian: 7%
- Multiracial: 3%
- Arab: 3%
- Prefer Not to Say or “Other”: 1%
*Targeted to reflect the 2020 U.S. Census
Age
- 54 or older: 9%
- 45 – 54: 18%
- 35 – 44: 26%
- 25 – 34: 32%
- 18 – 24: 15%

Satisfaction With the Amount of Communication Received
The big takeaway from our survey was that frontline employees are mostly satisfied with communication.
70% of respondents said they were either “Satisfied” or “Extremely Satisfied” with the communication they receive. This is slightly higher than in 2021, which could be an indication that improved methods of communication are helping companies reach their increasingly dispersed workforces.
| Level of Satisfaction | % of Respondents |
|---|---|
| Extremely Dissatisfied | 3% |
| Dissatisfied | 12% |
| Neither Satisfied/Dissatisfied | 16% |
| Satisfied | 49% |
| Extremely Satisfied | 21% |
Frontline Managers Are More Satisfied Than Frontline Workers
Similar to our 2021 survey, we found that there was still a gap between manager and non-manager satisfaction with communication. 76% of frontline managers were satisfied or extremely satisfied, whereas only 60% of non-managers reported that level of satisfaction.
Although both managers and non-managers were marginally more satisfied with the amount of communication they received this year, the gap in satisfaction remained the same (a 16-point difference).
Furthermore, fewer non-managers were “Neutral” about the communication they received, leaving 11% of managers dissatisfied or extremely dissatisfied and 19% of non-managers feeling the same.
Disparities Across Industries Narrow Regarding Employee Satisfaction With Communication
On a positive note, we did not see specific industries struggling more with employee satisfaction than others like we saw in 2021. Workers in healthcare, hospitality, manufacturing, and logistics all had very similar satisfaction rates:
- Hospitality: 68% satisfied
- Healthcare: 71% satisfied
- Manufacturing: 69% satisfied
- Logistics: 75% satisfied
In 2021, 63% of healthcare employees and 69% of logistics employees said they were “Satisfied” or “Extremely Satisfied.” So, these results show that a lot of the pressures from COVID-19 are slowly abating and helping employees in these industries recover.
The only major dip in satisfaction we saw year-over-year was for manufacturing workers. In 2021, 73% of manufacturing employees said they were “Satisfied” or “Extremely Satisfied,” which dropped 5% in 2022.

Channel Analysis: Current vs. Desired Channels of Communication
Heavy Reliance on Email and Face-to-Face YoY, But Mobile-First Channels Make Up Ground
We asked frontline workers to share what channels they currently have access to and then asked what channels they want access to. Here’s what they said:
| Channel | Currently Have Access | Want Access |
|---|---|---|
| 67% | 57% | |
| Printed Materials | 18% | 8% |
| Text | 57% | 51% |
| Employee App | 25% | 19% |
| Intranet | 13% | 9% |
| Face-to-Face | 66% | 56% |
In 2021, the most commonly used channels for communication were email and face-to-face just like this year’s survey findings show. However, more companies now report using text messages and employee apps for communication than they did last year, with demand for these channels also increasing.
Printed materials and intranets continue to be less commonly accessible to frontline workers and also less desired. However, intranets are ideally suited for a deskbound audience, so this is not cause for concern.
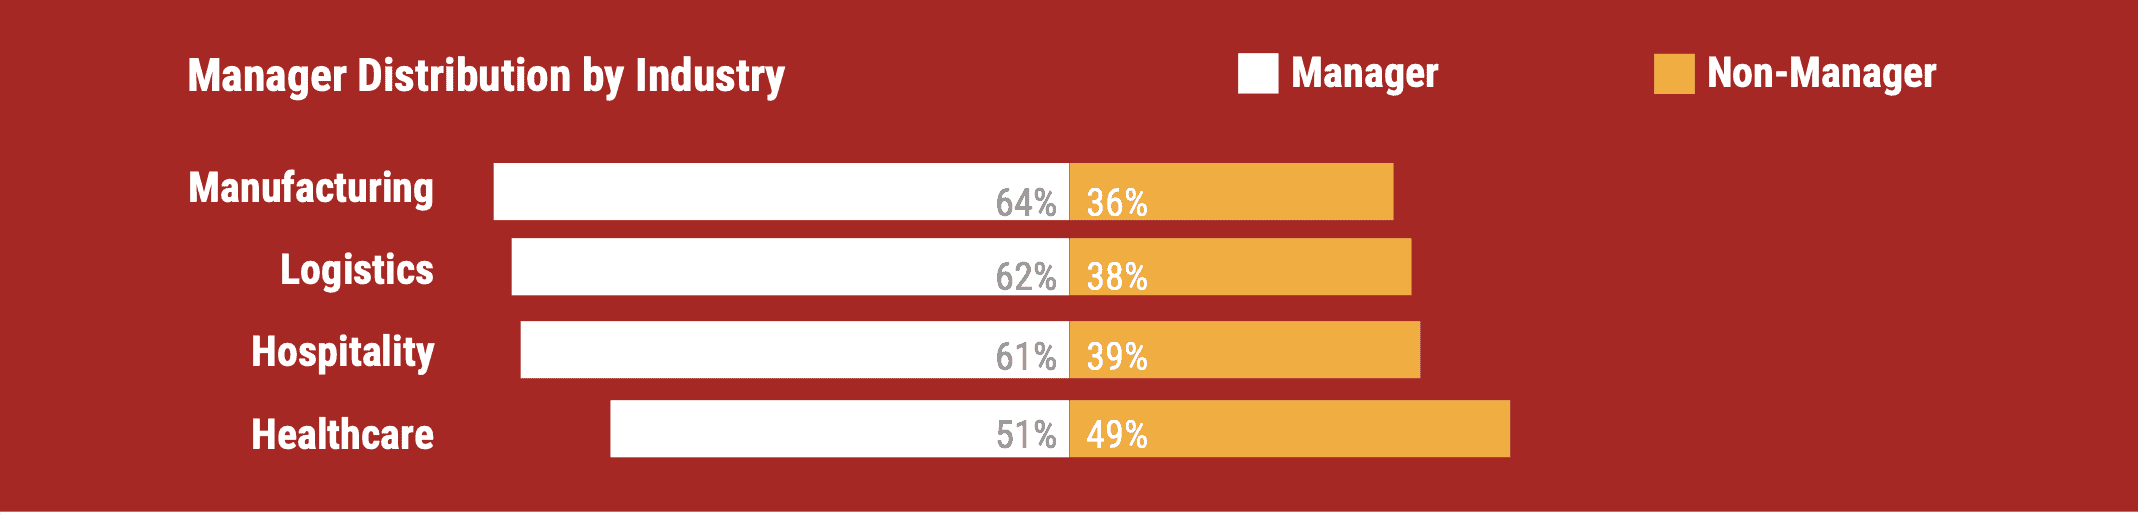
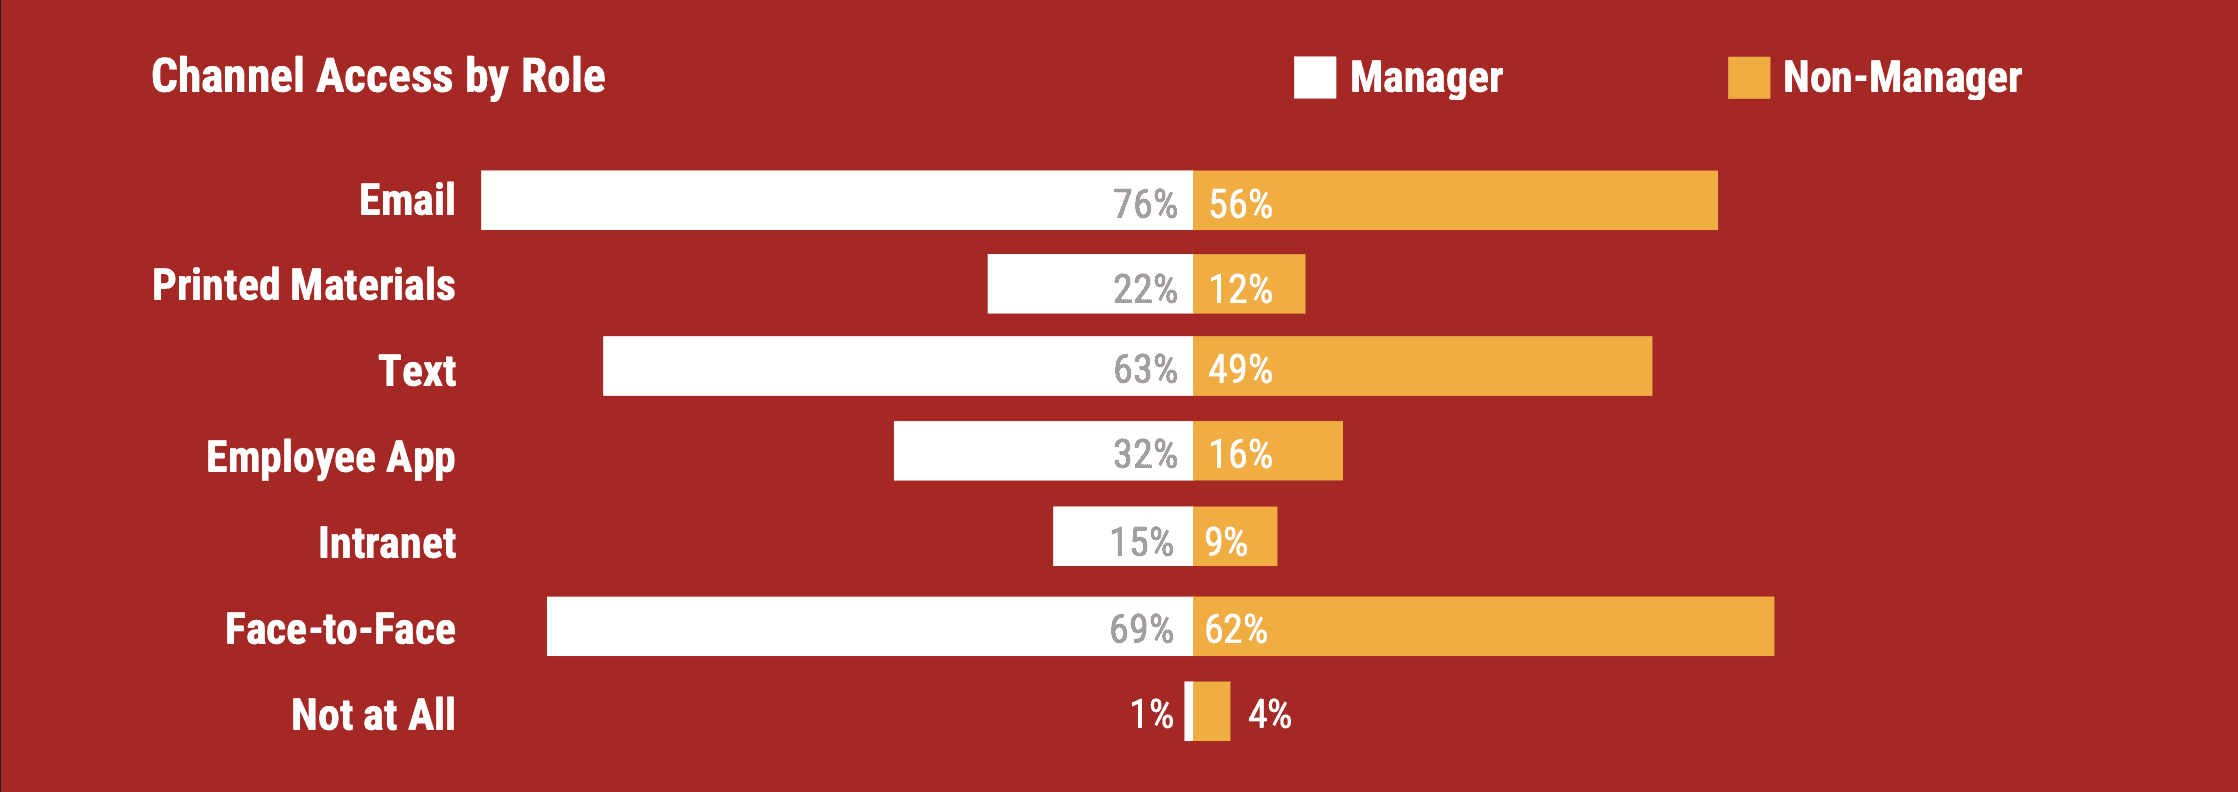
Manager Access to Channels and Communication Exceeds That of Non-Managers
It is possible that managers are more satisfied with communication because they receive enough of it on a larger variety of channels. Managers said they had access to each channel more often than non-managers.
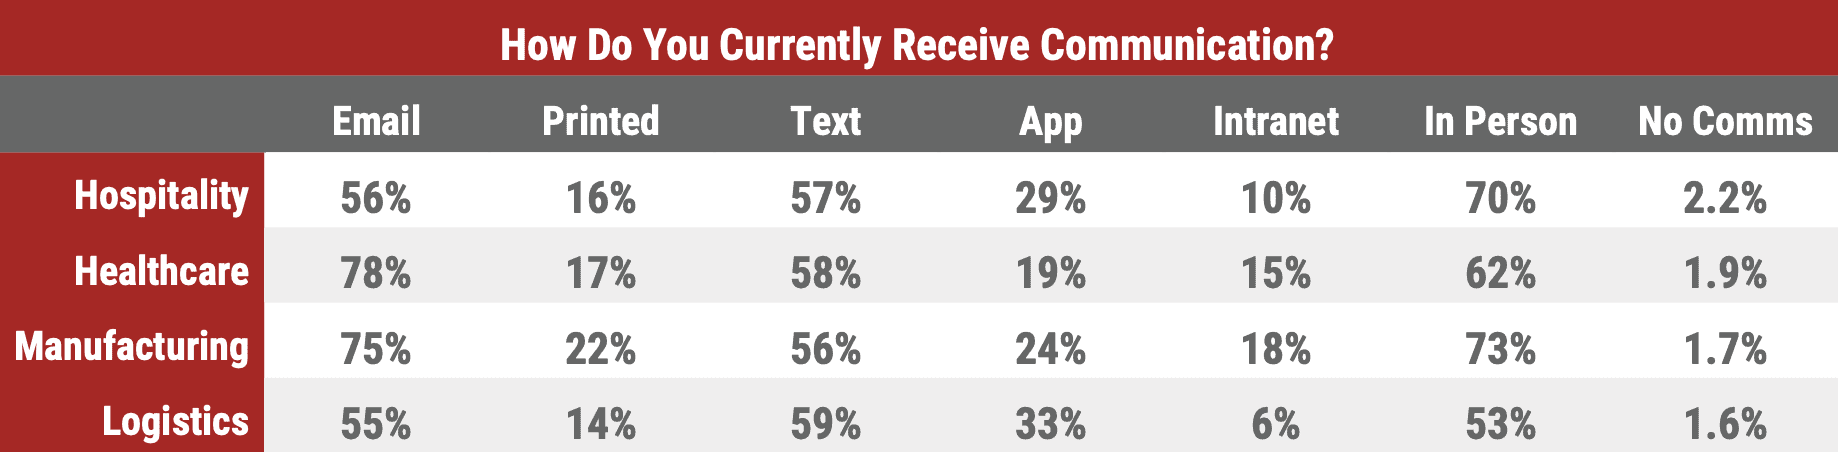
Channel Access Varies by Industry
Understandably, employees in certain industries have more access to certain channels than others. Logistics and hospitality employees, for instance, had significantly less access to email and intranets than employees in healthcare and manufacturing, who often have shared computers or workstations to use.
Other highlights:
- Hospitality and healthcare employees were the most likely to report receiving no communication whatsoever (2%).
- Hospitality (70%) and manufacturing (73%) had the highest reported rates of face-to-face communication.
- The highly mobile employees in logistics (33%) and hospitality (29%) had more access to mobile employee apps.
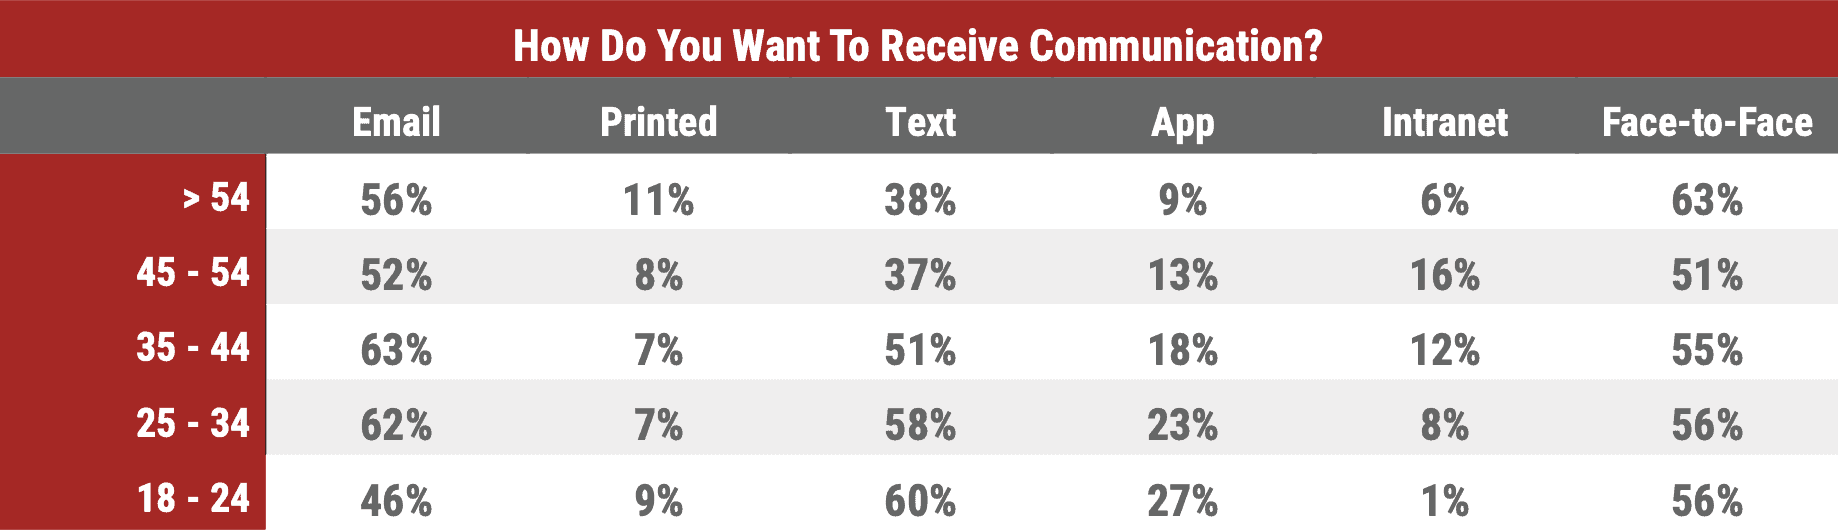
Age Impacts Channel Preferences: Younger Generations Want More Mobile-Enabled Comms
Regardless of age, printed materials and Intranets tend to be the least popular channels, but 18 – 24 year olds really do not want your Intranet. Mobile-first channels like testing and employee apps also dramatically increase in popularity with younger demographics.
Topics of Interest to Frontline Workers
In 2021, the most popular topics that employees wanted to receive communication about were:
- Benefits (61%)
- Recognition (46%)
- Safety (42%)
- Training (41%)
- Organizational Changes (37%)
In 2022, the same five topics came up. This shows that employees ultimately care about their development and the WIIFM (“What’s in it for me?”). If we cannot provide this information, we are missing out on a huge opportunity for engagement.
Here’s the 2022 breakdown of the topics frontline workers want covered in employer communications:
| Topic | % of Employees |
|---|---|
| Employee Benefits | 63% |
| Employee Recognition | 48% |
| Training & Development | 44% |
| Safety Updates | 35% |
| Organizational Changes | 32% |
| State of the Business | 27% |
| Internal Job Postings | 23% |
| Content That’s Just for Fun | 22% |
| DEI | 20% |
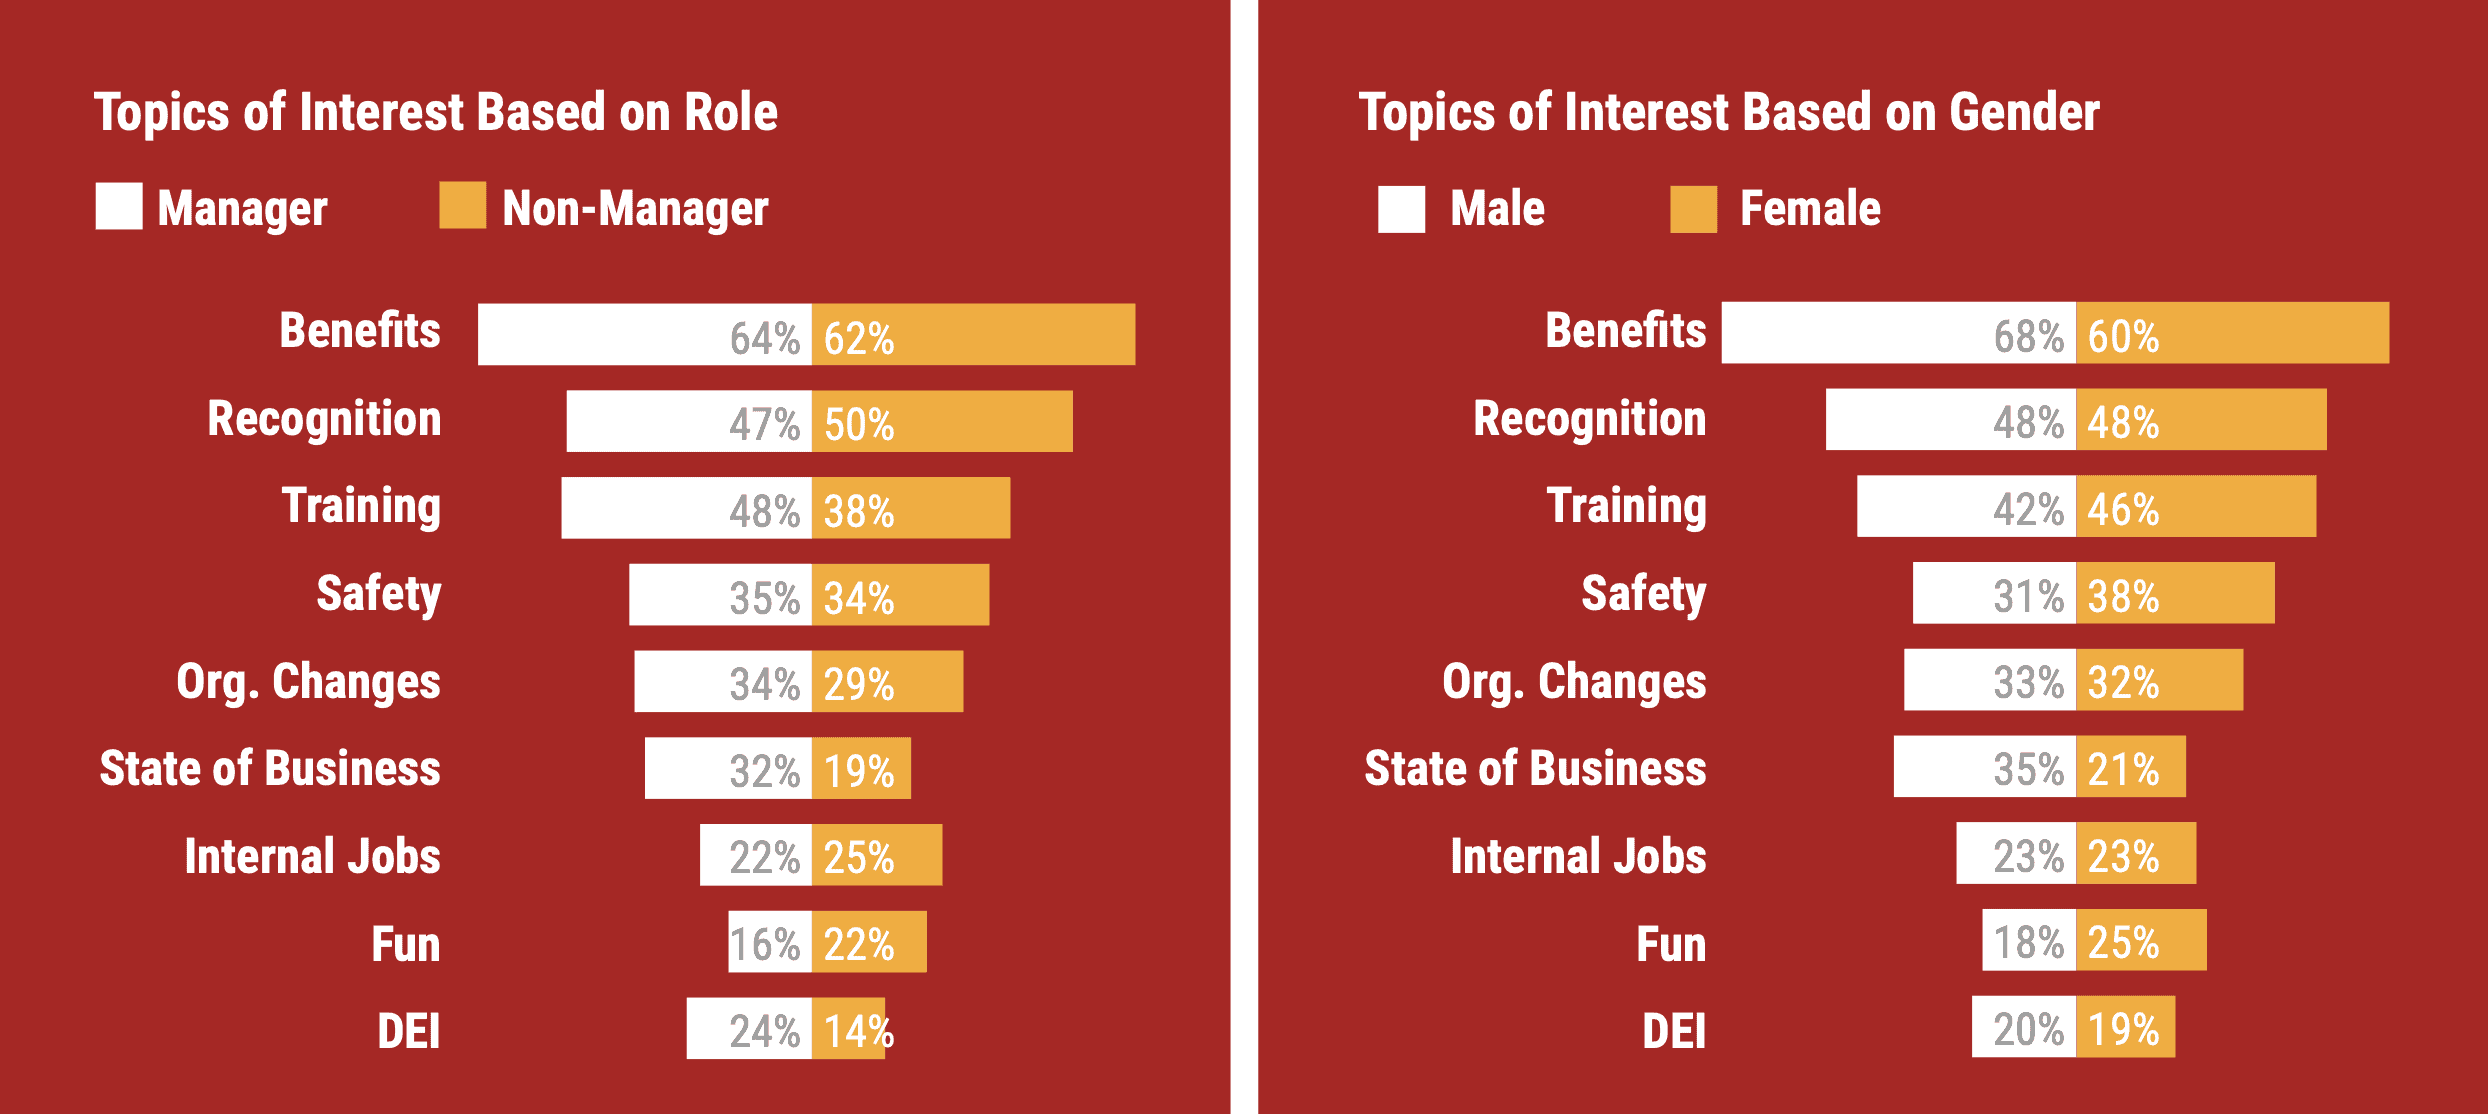
Role and Gender Impacts On What Topics Matter Most
Managers and non-managers largely agree on topics, except managers were much more interested in DEI, training, and the state of the business than non-managers.
Men and women largely agree on what topics are important, except in a few instances. Women were more likely to want safety and just-for-fun content than men. And men were much more interested in the state of the business than women. These gender differences mirror our 2021 results.
Willingness to Use Personal Devices for Company Comms
Vast Majority of Frontline Workers Are Willing to Use Personal Devices for Work
More than 4 in 5 employees (82%) say they would use their personal phone for communication. This makes adopting channels like texting and mobile apps more accessible to companies.

Top Arguments For and Against BYOD
Employees who were in support of bringing their own device cite ease, convenience, and a general lack of concern about it. Those who were opposed were mainly concerned about the personal cost to them.
| Top Reasons Supporting BYOD | Top Reasons Against BYOD |
|---|---|
| Convenience (44%) | They want work/life separation (45%) |
| Generally indifferent (11%) | Employer should cover cost (21%) |
| For communication & better access to people/info (9%) | Personal privacy concerns (20%) |
| They don’t want a second device (8%) | Employer should provide a phone (8%) |
| They already use their phone for work (6%) | Not secure for the company (3%) |
Levels of Engagement, Trust & Retention
Employees Report Being Engaged at Work
We defined engagement for our survey respondents as being “committed to one’s job and motivated.” Despite, Gallup’s gloomy outlook on engagement, the average frontline worker reported being mostly or completely engaged. These numbers are fairly consistent with what we saw in 2021.
| Level of Engagement | % of Employees |
|---|---|
| Not At All Engaged | 1% |
| Most Not Engaged | 5% |
| Neither Engaged or Disengaged | 11% |
| Mostly Engaged | 49% |
| Completely Engaged | 34% |
Engagement is Dictated by Role
86% of managers said they were either mostly or completely engaged at work compared with 78% of non-managers.
Interestingly, the same amount of managers and non-managers are “Mostly Engaged” with the far more non-managers feeling neutral and less reporting being “Completely Engaged” than their managerial counterparts.
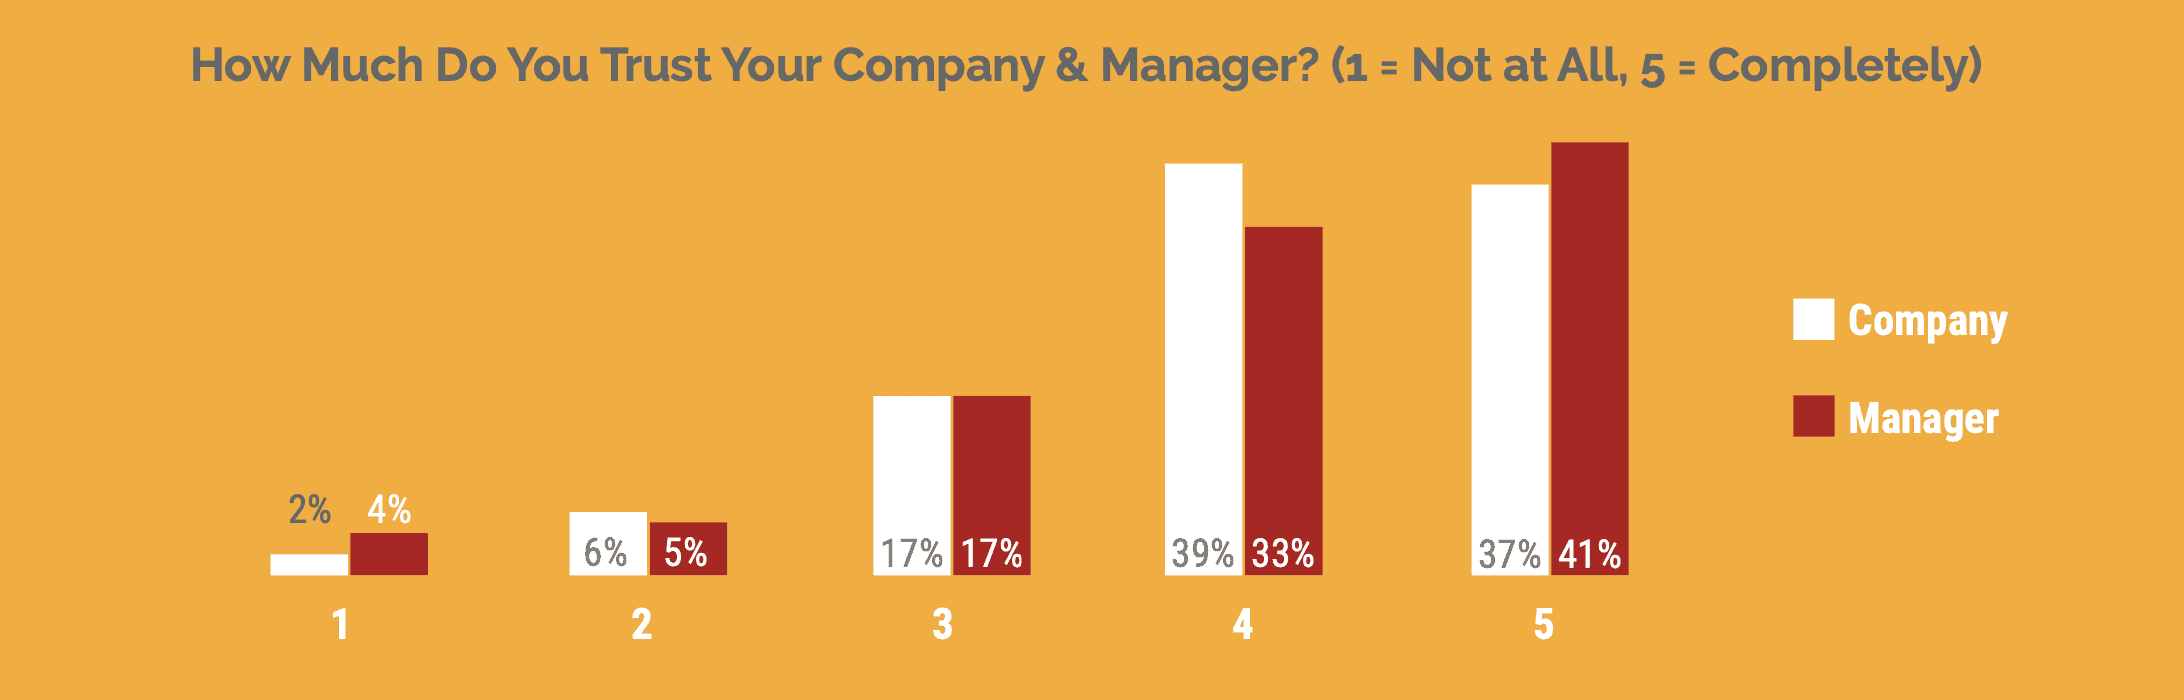
Employees Mostly Trust Both Their Company and Direct Manager
Like we saw in 2021, employees mostly trust who they work for. On a positive note for businesses, these scores actually went up slightly this year. In 2021, 69% of employees said they trusted their company and 69% trusted their manager (a score of 4 or 5). In 2022, those numbers rose to 76% and 74%, respectively.
Retention Outlook is Good
Perhaps a sign that the worst of the Great Resignation is behind us, self-reported retention is very high, with the majority of employees (83%) planning to stay at their company for at least one year and many of those saying they want to stay more than three years (55%).
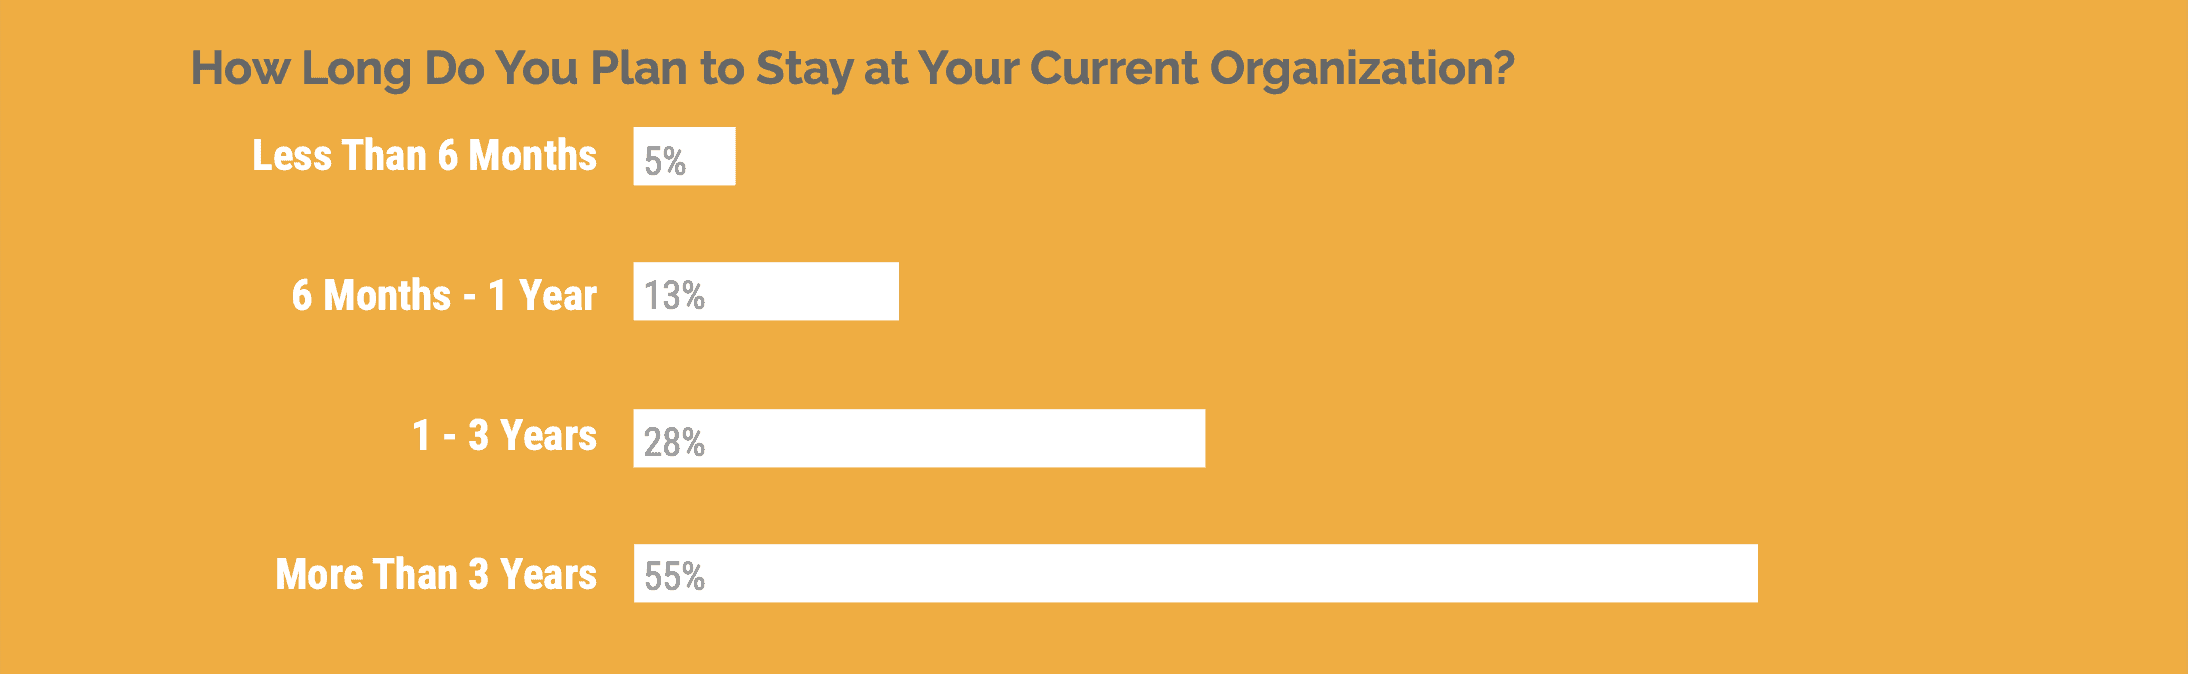
There are not huge discrepancies across industries. However, hospitality and logistics, which typically see high turnover, have the least percentage of employees planning to stay more than three years.
Managers are more likely to report they will stay 1+ years (85%) compared with non-managers (78%).
What Could Be Improved About Company Communications?
We asked our survey participants to write in the one thing that they thought could be improved about communication from their employer—either from corporate or from their direct manager.
| Answer | % of Respondents |
|---|---|
| Nothing (or Unsure) | 33% |
| More Communication | 22% |
| Improve Quality of Communication | 12% |
| More Respectful | 8% |
| Less Communication | 6% |
| More Timely | 6% |
| More Transparency | 3% |
| Improve Channels of Communication | 2% |
| More Recognition | 2% |
| Improve When Comms Are Sent | 1% |
Trends Over Time
- In 2021, 27% were not sure what could be improved or believed nothing needed to be changed. This was a more common answer in 2022, marking a positive improvement.
- In 2021, 14% wanted to receive more communication. This jumped to 22% this year.
- In 2021, 2% wanted to be communicated to more respectfully. This jumped to 8% this year and was largely from non-managers wanting managers to be more respectful.
Key Takeaways
Our 2022 findings show that is a lot that internal comms professionals should be proud of. Satisfaction, engagement, and retention data are all overwhelmingly positive. But our survey has found that there are areas where we should focus to improve the employee experience for both our managers and non-managers.
Differences Between Managers & Non-Managers
Like in 2021, the most notable trend in the data is the large discrepancy between the manager and non-manager’s experience. This is highlighted by the difference in satisfaction with the amount of messages they receive.
16% more managers are satisfied or extremely satisfied with the amount of communication they receive compared to non-managers.
Across the board, managers have more access to channels. More access to communication likely means these managers feel more informed and more equipped to do their jobs. And satisfaction with communication seems correlated with managers also having higher engagement, retention, and trust.
What does this mean?
- You need more direct channels of communication for frontline workers who aren’t managers.
- You need to focus on manager comms to ensure they are relaying messages properly and having better one-on-one conversations with their direct reports. Face-to-face communication is still king, but you have to coach your managers on how to be good communicators.

Differences Between Men and Women
Men and women tended to not be very divided on the topics we covered in the survey. However, there were slight differences in their preferred topics.
- 25% of women want “just for fun” content vs. 18% of men.
- 38% of women want “safety” content vs. 31% of men.
- 21% of women want “state of the business” content vs. 35% of men.
Although the gaps in topic preferences are not very wide, they do indicate that there are different values and priorities being placed on content based on audience demographics.
What does this mean?
- You may need to create personas to target messages better.
- You need to consider audience preferences more when creating your content strategy. Don’t assume all your employees feel the same way about everything.
Differences Between Age Groups
Trends have begun to emerge between different age groups in the workplace. Although, for the most part, age did not dictate what topics and channels employees preferred, there were a few exceptions:
- Younger employees prefer mobile channels. 60% said they want text; the average was 51%. 27% want an employee app; the average was 19%.
- Younger employees are more concerned with diversity, equity, and inclusion. 23 percent of 25 – 34 year olds and 25 percent of 18 – 24 year olds say they care about DEI; the average was 20% and only 7% those older than 54 said they care about this topic.
What does this mean?
- The generational divide is coming to the workplace. We need to start preparing to embrace the needs of all generations represented in the workforce.
- Each age category had more in common than you might expect. Avoid making assumptions about employee needs based on generation.
A Shift Towards Mobile Channels
Mobile channels made the most headway in 2022 compared to our 2021 results.
| Year | % With Access to Texting | % With Access to Employee Apps |
|---|---|---|
| 2021 | 44% | 16% |
| 2022 | 57% | 25% |
What does this mean?
- More companies are embracing new channels to reach dispersed workforces.
- Employees have more options than ever before, helping with satisfaction and engagement year over year.
Differences Between Industries
For the most part, an employees’ industry did not impact their interests, channels, and levels of satisfaction by a large margin. But there were some key differences in channel access and trust:
- Logistics & Hospitality employees had more access to mobile first channels (texting/apps) than they had access to email and Intranets.
- Logistics employees notably had the highest trust in their direct manager (80%) than any other industry we tracked (73%).
What does this mean?
- Industries with deskless employees need to invest in tools that meet employees where they are.
- We need to continuously re-evaluate our channels for communication and targeting to reach people when it matters to maintain trust and high levels of engagement/satisfaction.

Making Sense of the Open-Ended Responses: What’s Broken In Internal Comms?
We received a lot of great responses to the open-ended question on the survey: what do you think could be improved about communication from your employer?
The big takeaways here are that there is a growing divide between managers and non-managers. Non-managers were giving the feedback that they needed to receive more communication and many more than in 2021 stressed the need for that communication to be more respectful.
More employees than in 2021 said they wished the quality of the communication they received could be improved. This included a wide range of specific improvements such as:
- Clarity
- Concision
- More Detail
- More Relevant/Targeted
- More Positive
- More Consistent
- More Direct
- Less Fluff
The feedback regarding comms channels was very mixed. For every person who expressed love for a channel, someone else expressed their disdain. This just proves that you cannot please everyone with a single channel, so having a diverse channel mix is a good strategy. Channel feedback ranged from:
- Fewer/More Channels
- More Digital Channels
- Fewer/More Emails
- Fewer/More Text Comms
- Less Use of Peer-to-Peer Chat
- Fewer Printed Comms
- Fewer/More Employee App Comms
- More/Fewer Phone Calls
We recommend conducting a survey internally where you ask your employees about their comms preferences and what they think could be improved with communication at your company. And then filter your responses as much as you can to learn what divisions/locations are struggling more with one issue than another.
The Future of Bring Your Own Device (BYOD)
Bring Your Own Device (BYOD) is a policy that states employees can use their own personal devices (phones, computers, tablets, etc.) for work.
Although increasing in popularity as a way for workers to access communication and resources to do their jobs, BYOD has faced some push-back over the years. But the results of this year’s survey are indicative that it’s time for BYOD policies to be embraced.
| Myth | Survey Result |
|---|---|
| Employees won’t want to use their personal device. | 82% of frontline workers are willing to use their personal phone for work communication. |
| Apps on personal phones encroach too much into employee privacy. | This is a widely held misconception. 20% of respondents who said they weren’t willing to BYOD gave privacy as the reason. That said, apps like theEMPLOYEEapp collect very little user data and mobile device preferences. And we even have the option for employers to turn off user data in their analytics dashboard. |
| Employees will expect to be compensated for time spent on their personal phones. | While 21% said they wouldn’t BYOD because they would want the cost to be covered for them, 44% said they would be willing to for convenience. |
| Allowing employees to use their phones at work would be too distracting. | BYOD does not mean workplace rules go out the window. If your company has a ‘no phones on the floor’ policy, that still stands. BYOD only means they can access systems at appropriate times using their own devices. |
| Older employees won’t want to BYOD and might not even own a smartphone. | PEW Research has found that 97% of adults in the US own smartphones. And 72% of our survey respondents older than 54 said they would BYOD. |
Next Steps
Based on these survey results, we recommend that you do three things: implement an employee survey of your own, focus your attention on your managers, and conduct a channel audit.
Conduct Your Own Survey
It’s always a good idea to use employee surveys and focus groups regularly to keep a finger on the pulse of what’s going on at your organization.
Are you a company where employees say “this is the best communication I’ve ever received” or are you a company where employees are highly dissatisfied with communication and feel disrespected? The only way to find out where you stand is to conduct a survey like this one and compare how you did to our benchmarks. And keep in mind that even if the results come back with the majority being satisfied with current communication, that doesn’t mean there isn’t still progress to be made. Even though the vast majority of our survey population were at least satisfied, we had a ton of very thoughtful write-ins for what could still be improved.
Audit Your Channels—Can You Reach Everyone Directly?
A channel audit is always a good idea. We recommend doing these annually and certainly when you start a new internal communication job. An internal comms audit helps you get an idea of how you’re currently sharing messages, what those messages are, and what audiences are receiving which messages and how. Even if you think you’ve got a handle on this, things change regularly. New channels emerge, new messages need to be sent, and employee preferences change. So conduct an audit each year to stay on top of the state of IC at your organization.
[optin-monster slug=”gc3xpuwvamxg0qgjdvxu” followrules=”true”]
Focus on Your Managers
Redefining Communications, SocialOptic, and Gallagher’s “Line of Sight” report focuses on the role of line managers, specifically as it pertains to their role as communicators. And their research has also pointed to a very important truth: we need to better support our line managers. They aren’t necessarily trained leaders or communicators, but a huge weight of responsibility is put on them to convey key messages to their direct reports, to help with professional development of their teams, and to deliver business results.
And this lines up with what we see in our survey. Managers are receiving more comms and are more satisfied than the frontline teams they lead. So, we need to focus on them more. Whether this is giving them more talking points for their teams or investing in more training and development for their leadership and comms skills.
[optin-monster slug=”ucyxtz2fxemh6aryl4gg” followrules=”true”]